🔬 Semiconductor Physics & Cell Benchmark
N-Type TOPCon vs P-Type PERC Solar Panels: Real-World Efficiency & Heat Loss Test
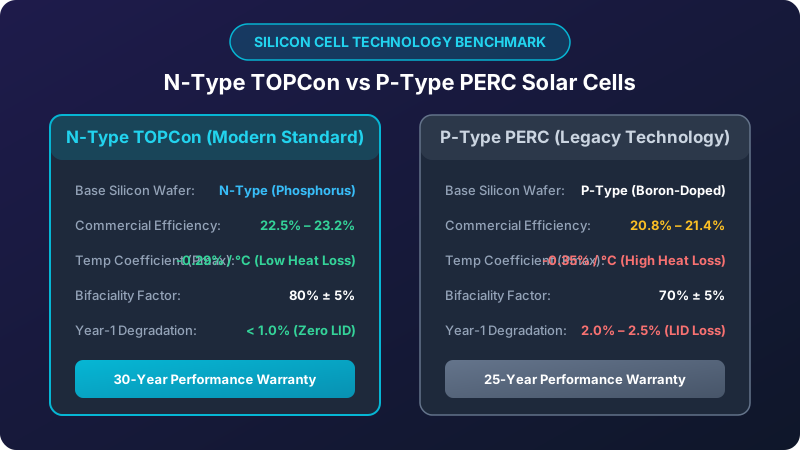
The global solar manufacturing sector has made a decisive transition from P-Type PERC to N-Type TOPCon (Tunnel Oxide Passivated Contact) cell architecture. What does this semiconductor upgrade mean for real-world rooftop performance, summer heat degradation, and 30-year return on investment?
2. Temperature Coefficient: Real-World Afternoon Performance Test
Solar panels lose power as they heat up. The Temperature Coefficient of Pmax measures the exact percentage drop in electrical output for every 1°C increase above standard laboratory test temperature (25°C).
| Operating Condition |
P-Type PERC Module (585W) |
N-Type TOPCon Module (585W) |
Net Advantage |
| Lab STC Rating (25°C Cell Temp) |
585.0 Watts |
585.0 Watts |
Identical laboratory rating |
| Mild Spring Day (45°C Cell Temp) |
544.0 Watts (-7.0% loss) |
551.0 Watts (-5.8% loss) |
+7.0 Watts (+1.3%) |
| Hot Summer Afternoon (65°C Cell Temp) |
503.1 Watts (-14.0% loss) |
517.1 Watts (-11.6% loss) |
+14.0 Watts (+2.8%) |
| Extreme Desert Roof (70°C Cell Temp) |
492.8 Watts (-15.75% loss) |
508.6 Watts (-13.05% loss) |
+15.8 Watts (+3.2%) |
In hot Asian climates where rooftop temperatures regularly exceed 65°C, an N-Type TOPCon array generates 3% to 5% more total energy daily compared to a PERC array of identical nominal wattage.
5. Low-Light Response & Final Purchasing Recommendations
Beyond temperature tolerance, N-Type TOPCon cells exhibit superior spectral response in the ultraviolet and infrared wavelengths. During overcast monsoon mornings, hazy dawn hours, and late sunsets, TOPCon modules reach inverter MPPT startup voltage 15 to 25 minutes earlier in the morning and shut down later in the evening compared to PERC.
Furthermore, modern N-Type modules utilize 16-Busbar (16BB) or SMBB (Super Multi-Busbar) round ribbon interconnects. The dense circular wire design reduces current path length by 50%, virtually eliminates hot-spot failure risks caused by microscopic wafer hairline cracks, and improves mechanical load resilience against heavy hailstorms and typhoon winds.
Buyer's Verdict for 2026 Installations:
Given that the market price gap between N-Type TOPCon and P-Type PERC has narrowed to less than Rs. 2 to Rs. 3 per Watt (approx. $0.01/W), installing legacy P-Type PERC is no longer financially justifiable for new projects. TOPCon delivers 5% to 8% higher lifetime energy yield, zero first-year degradation risk, and a 30-year guaranteed revenue stream.